Saiyō framework
The Hiring Economics Curve
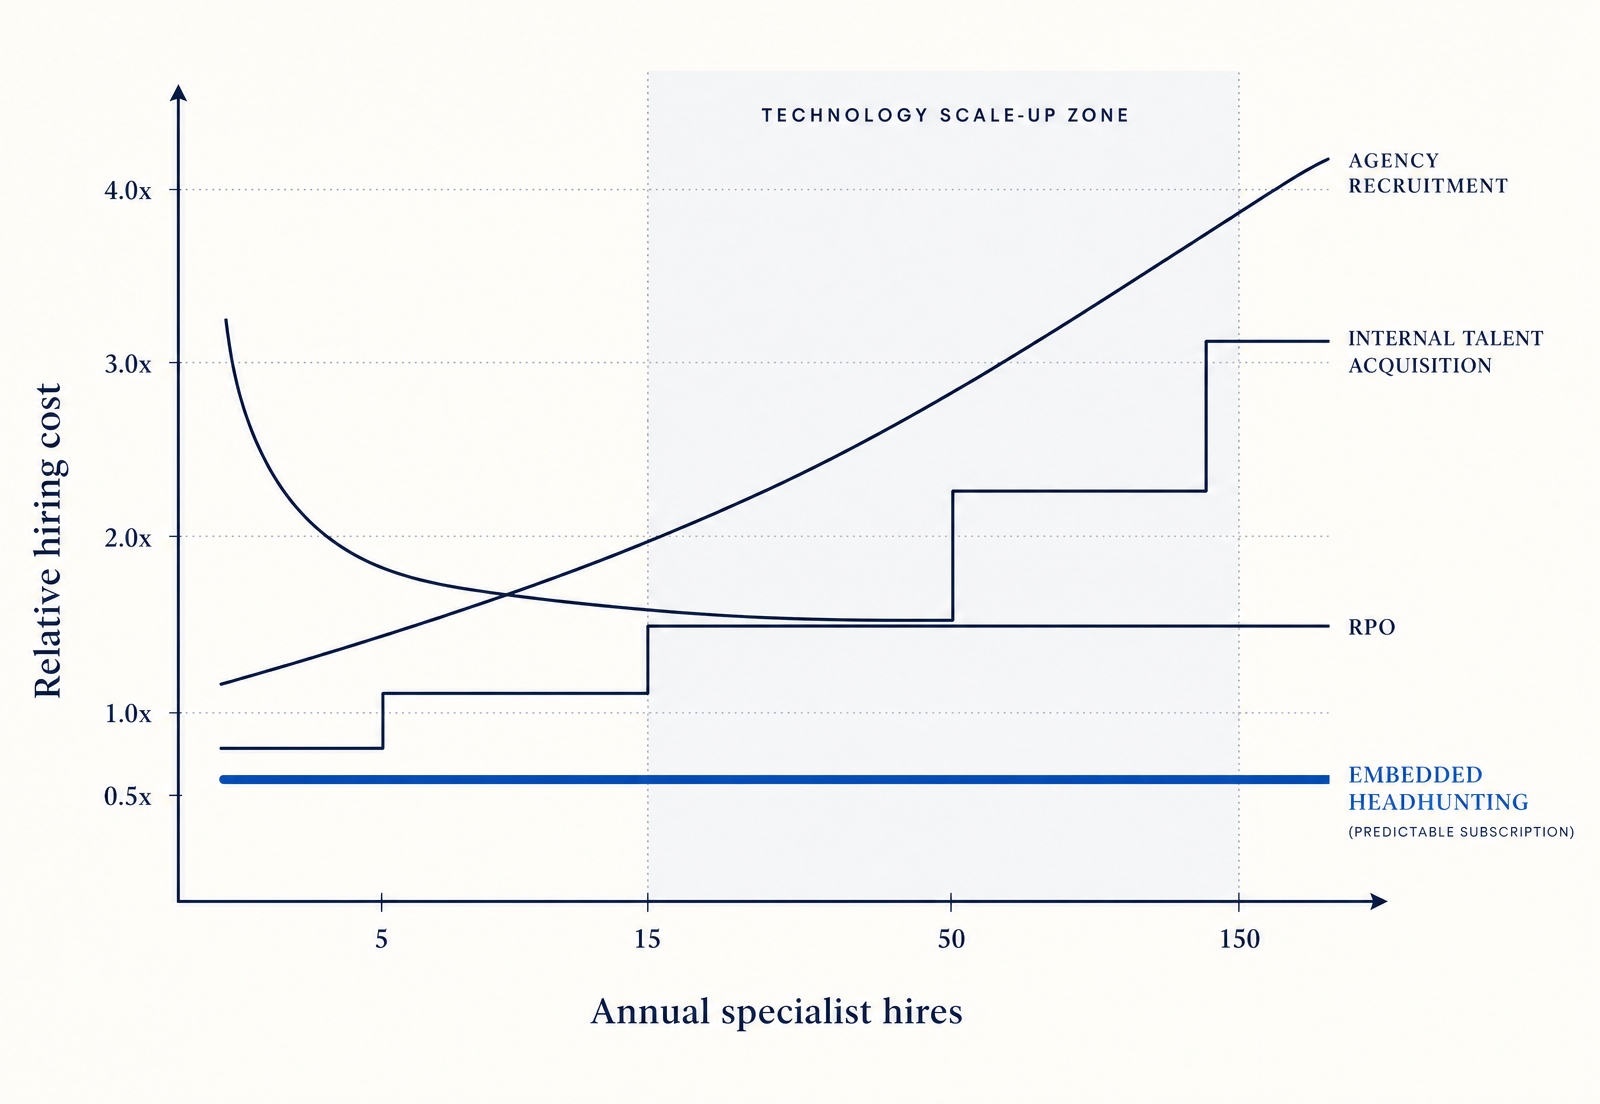
Relative cost per specialist hire across agency, internal TA, RPO and embedded headhunting as annual volume grows.
What the framework says
Each model has a different economic shape. Contingent agency cost rises with volume, internal TA moves in step-changes, RPO carries a fixed operational base, and embedded headhunting flattens on a predictable subscription, becoming the cheapest option inside the technology scale-up zone.
When to use it
You are weighing the total economics of hiring models across a full year rather than a single hire.
How to apply it
- 1Use annual plan volume, not the current open requisitions, as the input.
- 2Add the cost of delay: unfilled specialist roles carry a revenue or delivery cost per week.
- 3Compare like for like, including internal time spent managing multiple suppliers.
- 4Decide the model per role group, then review the economics each half-year.
The common mistake
Optimising for the lowest fee on the next hire instead of the lowest cost across the plan.
Read the full guide
What is embedded recruitment?
Embedded headhunting combines the proactive search capability of a specialist headhunt firm with the operational integration of an internal talent team.
Open the guide